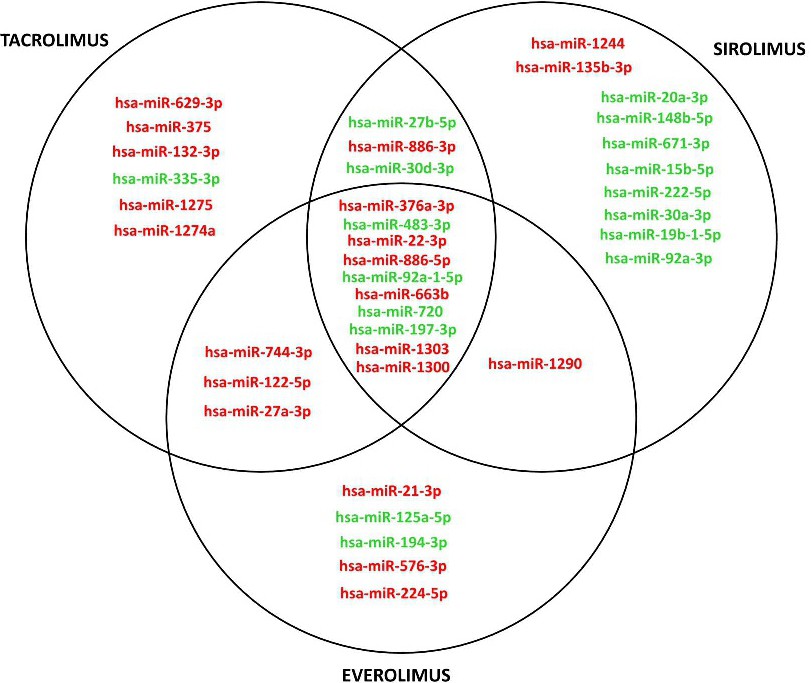
Fig. 10. Up- (red) and down-regulation (green) of miRNA expression in Tacrolimus-, Sirolimus- and Everolimus-treated HepG2 cells. Treatments were administered at 10 µM final concentration. The expression of miRNA was analysed using a commercial TaqMan(r) OpenArray(r) Human miRNA Panel as described in Material and Methods. miRNA data are obtained from three independent experiments.